Ultrasound · Doppler angle · deep neural networks
Doppler Angle Estimation with Deep Neural Networks
GitHub · arXiv:2508.04243 · IEEE EMBC 2019
The problem and the idea
Vascular ultrasound measures blood-flow velocity with spectral Doppler, and that measurement depends on the angle θ between the ultrasound beam and the vessel. The scanner cannot determine θ on its own. In current practice the sonographer reads it off the screen and sets it by hand, an operator-dependent step that is repeated on every exam.
This matters because the reported velocity scales with 1 / cos θ. At the steep angles used in practice, a few degrees of error in θ produce a large error in velocity, and velocity is the quantity a clinician acts on, for example when grading how narrowed a carotid artery is. Improper angle correction is a well-documented and recurring source of error in vascular labs.
This project tests whether θ can be estimated automatically from a single grayscale B-mode image, without color Doppler or manual segmentation, using a deep neural network in place of the hand-set angle. It reproduces and extends our EMBC 2019 study. The headline result is just below, and the Method, Results, and Clinical pages document the rest, with every number reproducible from code.
Why a few degrees of angle is a velocity problem
Spectral-Doppler velocity is recovered from the Doppler equation,
\[f_d = \frac{2\,f_0\,v\cos\theta}{c} \quad\Longrightarrow\quad v \propto \frac{1}{\cos\theta},\]where \(f_d\) is the measured frequency shift, \(f_0\) the transmit frequency, \(c\) the speed of sound, and \(\theta\) the angle between the ultrasound beam and the vessel flow. Because velocity scales as \(1/\cos\theta\), an error in \(\theta\) propagates straight into the reported velocity, and the sensitivity \(\tan\theta\) grows sharply as \(\theta\) approaches the steep angles used in practice: near 60°, each additional degree of angle error moves the reported velocity by about three percent.
The angle is set manually by the sonographer, which makes it a leading, operator-dependent source of velocity error. Reading it automatically from the image removes that step from the human, which is the motivation for the whole estimator.
What the ~35% accreditation figure does and does not say
Improper angle correction has been flagged in up to roughly 35% of vascular-lab accreditation applications (Saad 2009). That is a literature figure describing the field at large, not a measurement on this cohort, and it motivates the problem rather than quantifying anything this estimator was tested against.Rotate the beam and watch the velocity move
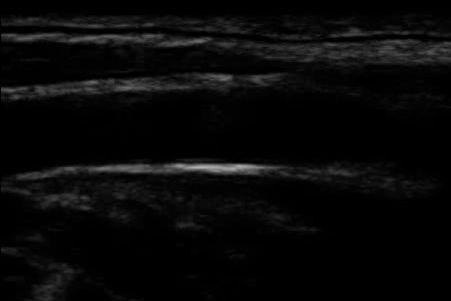
The slider below sweeps the ultrasound beam across a real B-mode image to set an illustrative beam-to-vessel angle \(\theta\), and shows, live, the fractional velocity error a clinic would inherit from it. The beam overlay is a synthetic teaching tool for the \(1/\cos\theta\) relationship; it is not the rotation-augmentation grid the model was trained on.
| θ (degrees) | Velocity multiplier × | Error vs 60° |
|---|---|---|
| 45 | 1.41 | −29.3% |
| 50 | 1.56 | −22.2% |
| 55 | 1.74 | −12.8% |
| 60 | 2.00 | 0.0% |
| 65 | 2.37 | +18.3% |
| 70 | 2.92 | +46.2% |
| 75 | 3.86 | +93.2% |
| 80 | 5.76 | +187.9% |
Headline results
The tuned stacked ensemble reproduces and improves on the EMBC 2019 paper’s best single model (≈ 2.87° MAE / 4.03% MAPE, image-level) and additionally reports the previously-unmeasured patient-level number.
| Estimator | Image-level sampling | Patient-level sampling | ||
|---|---|---|---|---|
| MAPE (%) | MAE (°) | MAPE (%) | MAE (°) | |
| Frozen DenseNet201 (grid pooling) | 5.84 | 3.77 | — | — |
| Tuned DenseNet201 | 4.03 | 3.00 | 10.80 | 8.62 |
| Tuned stacked ensemble (5 backbones) | 2.79 | 1.96 | 8.53 | 5.93 |
Two ways to be right
The same 2,100-image corpus is scored two complementary ways: an image-level protocol
that splits the augmented images at random (the original study’s lens), and a
patient-level protocol that splits by volunteer with GroupKFold so no subject appears
in both folds. Neither is wrong — the image-level number measures accuracy across the
full population of orientations, the patient-level number measures generalization to an
unseen patient, and the Method and
Results pages report both.
Why the patient-level number is the harder, more honest one
The patient-level result rests on a small, single-center cohort (~10 volunteers, 84 base images, one scanner, carotid only), with only about two held-out subjects per fold, so its cross-subject variance is non-negligible and its external validity to other anatomies or scanners is untested. The roughly 3× spread between the two protocols quantifies how much of the within-population accuracy is anatomy-specific.What this is not
This is a research re-implementation, not a clinical tool: nothing here is validated for diagnosis, deployment, or velocity or stenosis reporting, the backbones are frozen rather than fine-tuned, and a from-scratch CNN on this data fails outright. The 2,100 labelled examples are 25 rotated copies of 84 base images, not 2,100 independent samples, and the agreement analysis compares the model against a single reference reading per image rather than against a second observer. The full scope and limitations are on the Reproduce page.
Read on
- How the estimator is built — the data, the two protocols, the frozen backbone, and the grid-pooling thesis.
- Five backbones, two protocols, one ensemble — replication, the tuned best estimator, and the comparative analysis.
- What a clinic would actually need — conformal intervals, Bland–Altman agreement, test-time augmentation, and Grad-CAM.